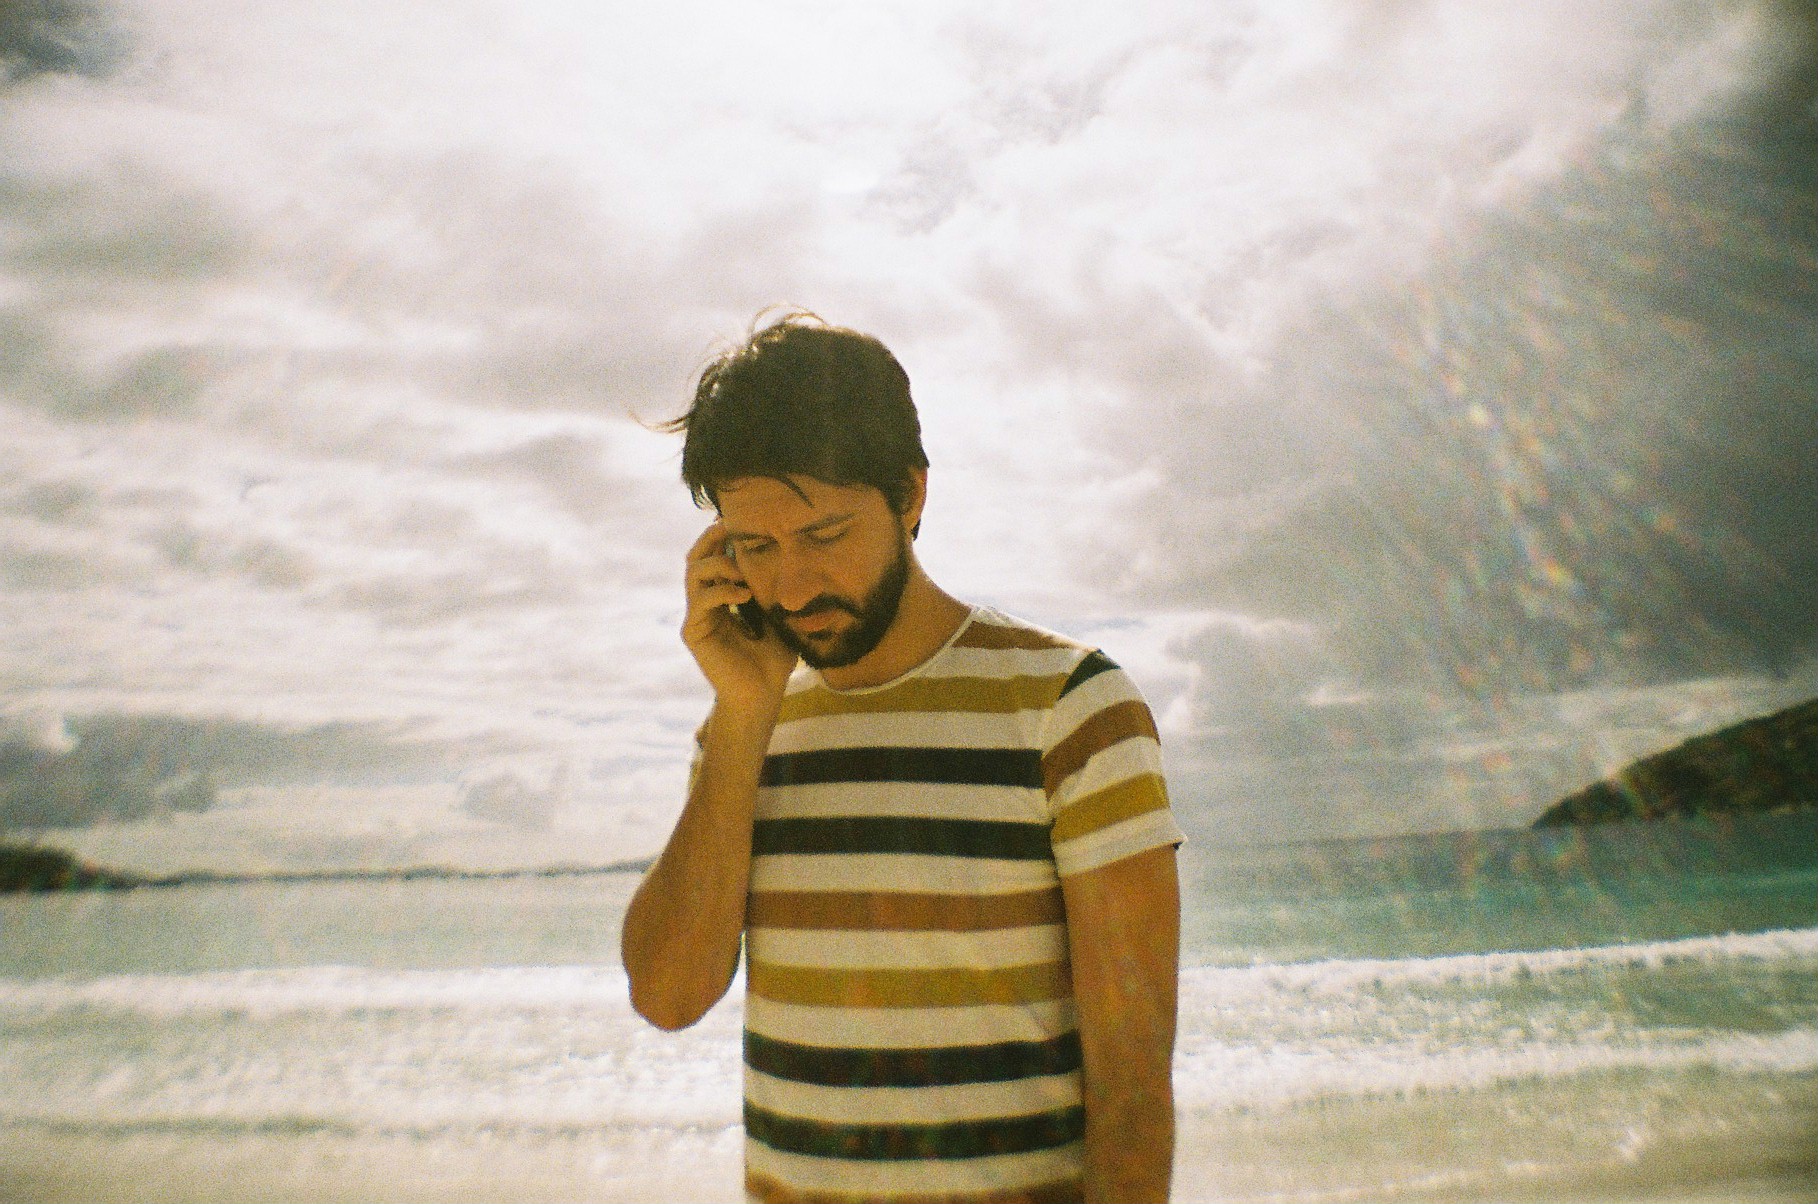
That's me in my beautiful hometown Vitória, Espírito Santo, Brazil
About
I am an information designer who builds things using drawing and code. I have been working with both print and digital media since 2006. My work focuses on data visualization and interaction.
I am currently a Graphics and Multimedia Editor at The New York Times.
I have worked for:
- The Wall Street Journal
- The Office for Creative Research
- Smart Design
- IDEO
- Metropolitan Museum Media Lab
- NYU School of Professional Studies
- Parsons School of Design
- Abril Communications
- Globo Publications
- Itaú Bank
I am from Brazil and I currently live in Brooklyn, NY.
Teaching
Data Visualization
Parsons School of Design, Spring 2016.
I developed the syllabus and taught this course combining basics of Data Visualization theory and hands-on coding. The program was split in 3 modules: visualizing for communication, focused on data manipulation and out-of-the-box tools like OpenRefine and CartoDB; visualizing for exploration, with an emphasis on interface design and D3; databases, about archives and server-side apps (NodeJS + MongoDB). Github repo here.
Web Advanced
Parsons School of Design, Fall 2015.
I developed the syllabus and taught an advanced web course focused on designing, building and deploying data-driven Web applications. It combined a mix of theory on interface design and hands-on coding — from front-end (JavaScript, Angular) and back-end (NodeJS) to databases (MongoDB). Github repo here. Student work here.
Interactive Data Visualization
NYU School of Professional Studies, Fall 2014 - Spring 2015.
I developed the syllabus and taught this course, approaching dataviz from loading to representing. It also includes case studies examined through a technical and conceptual lens and basic-level programming.
Code Bootcamp
MFA Design and Technology, Parsons The New School for Design. Summer 2014.
Introductory classes for the incoming students of the MFA DT program at Parsons. Besides teaching, I was chair of the Code instructors and helped develop the curriculum.
oF Course
Since 2014
oF Course is a creative coding program that utilizes openFrameworks as a tool to enhance creativity. I teach classes on computational drawing and data visualization.
Data Visualization and Programming
Since 2011
I have been teaching workshops on programming and data visualization, utilizing Processing, since 2011. Take a look into my CV for a full list of workshops.
Speaking
Revisiting Isotype: American Politics in Pictograms
Visualizing Health
Maps as a Tool for Perception
Cultural Analytics
Internodal 8 @ Dark Matter, September 2016
The Autocomplete Archive
Viz 4 Journalism
Interactive Narratives: Infographics and Data Visualization
IICS (International Institute of Social Sciences), Master of Digital Journalism Program, 2013.
Infograhics and Creative Process
Pixel Show, 2012.
Pixel Show is the largest Brazilian conference on art and creativity, with more than 10,000 attendees.
Data Visualization in Journalism
iPad: a Brief History and a Long Future Ahead
Infolide (Language, Information and Editorial Design), 2011.
Data Visualization
Campus Party, 2010.
Awards
The Society for News Design (SND)
- Bronze Medal, Business/Finance, Science, Technology, Transportation, Environment & Health, 2018
- Bronze Medal, Special Events – Elections, 2018
- Silver Medal, Magazine Redesign, 2016
- Award of Excellence, Magazine Overall Design, 2011
- Silver Medal, Magazine Feature/Cover Story Design, 2011
- Judge’s Special Recognition, Inside Features Magazine Design, 2010
- Award of Excellence, Inside Features Magazine Page Design, 2010
The Society of Publication Designers (SPD)
- Print Merit Winner, 2016
- Online/Rich Media Merit Winner, 2012
Cannes Lions Shortlist
Desafio GA (Alternate Reality Game), shortlisted in the “Media/Use of Mixed Media” category, France, 2008
Esso Journalism Awards
- Graphic Design Finalist, 2011
- Graphic Design Finalist, 2010